
Question title
How to adjust the display order of content in Tooltip of VChartStacked Bar Chart?
Problem Description
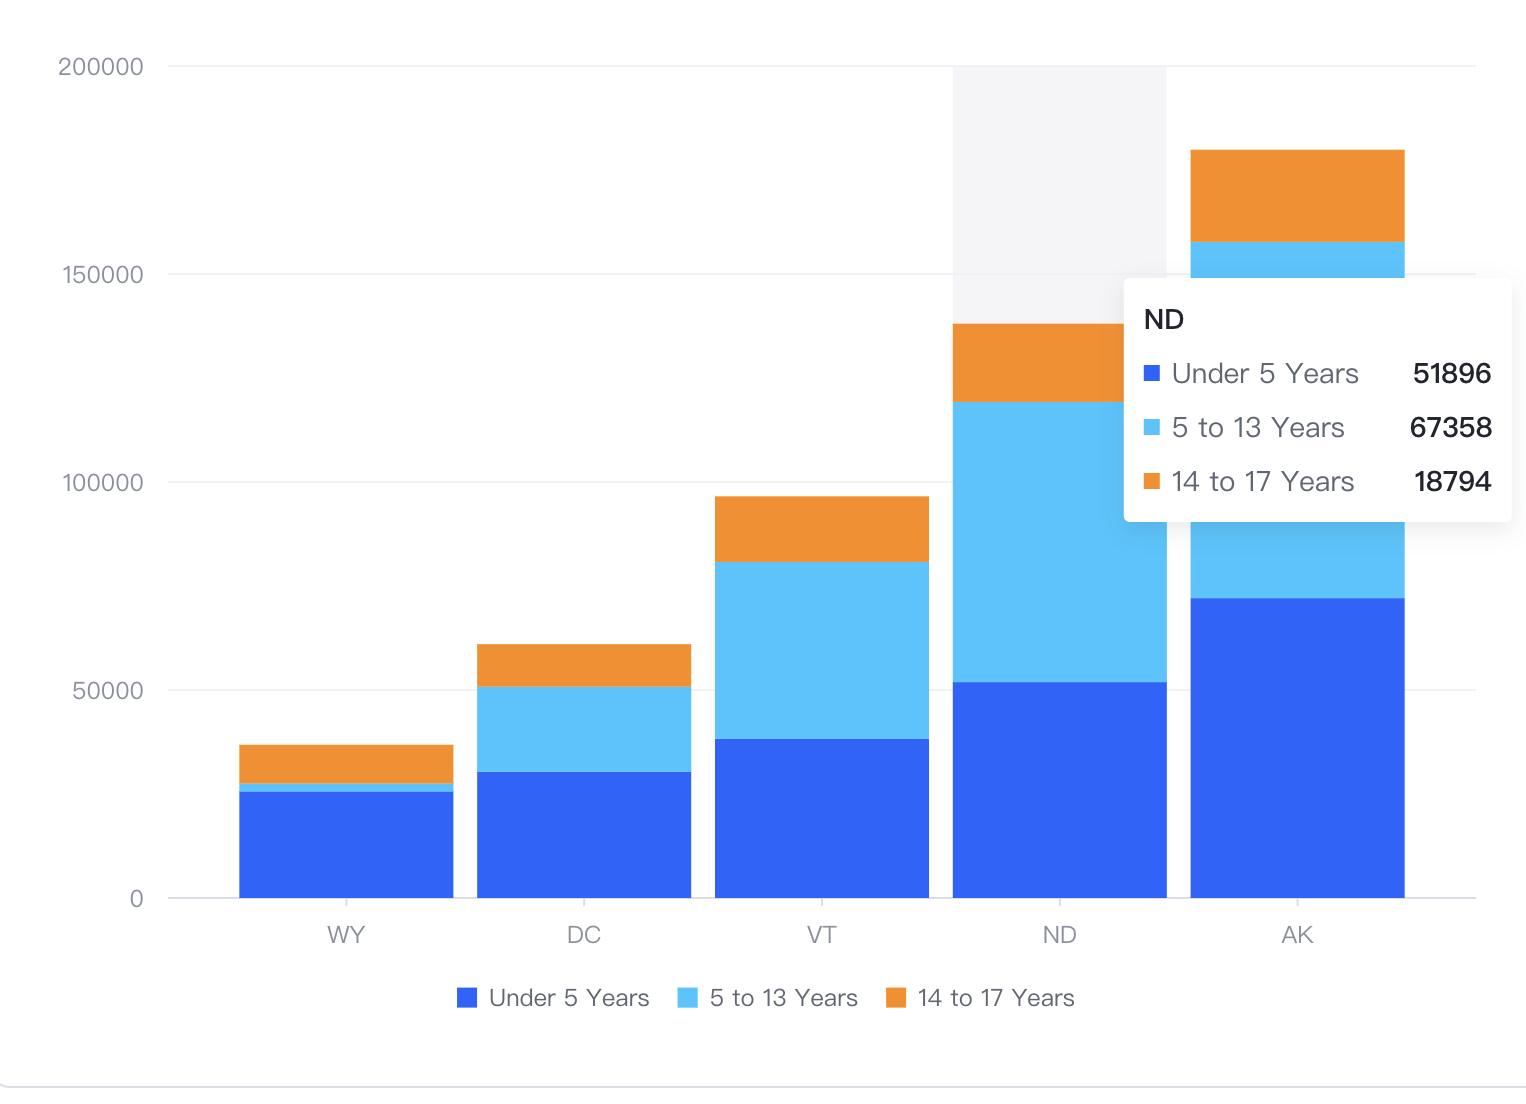
In a stacked bar chart, the stacking order seems to be reversed from the order of the data, and then the tooltip is reversed again. How can I make the color order of the bars consistent with the order of the tooltip?
Solution
For stacked bar charts, there are two solutions to make the order of the content in the tooltip consistent with the stacking order of the bars:
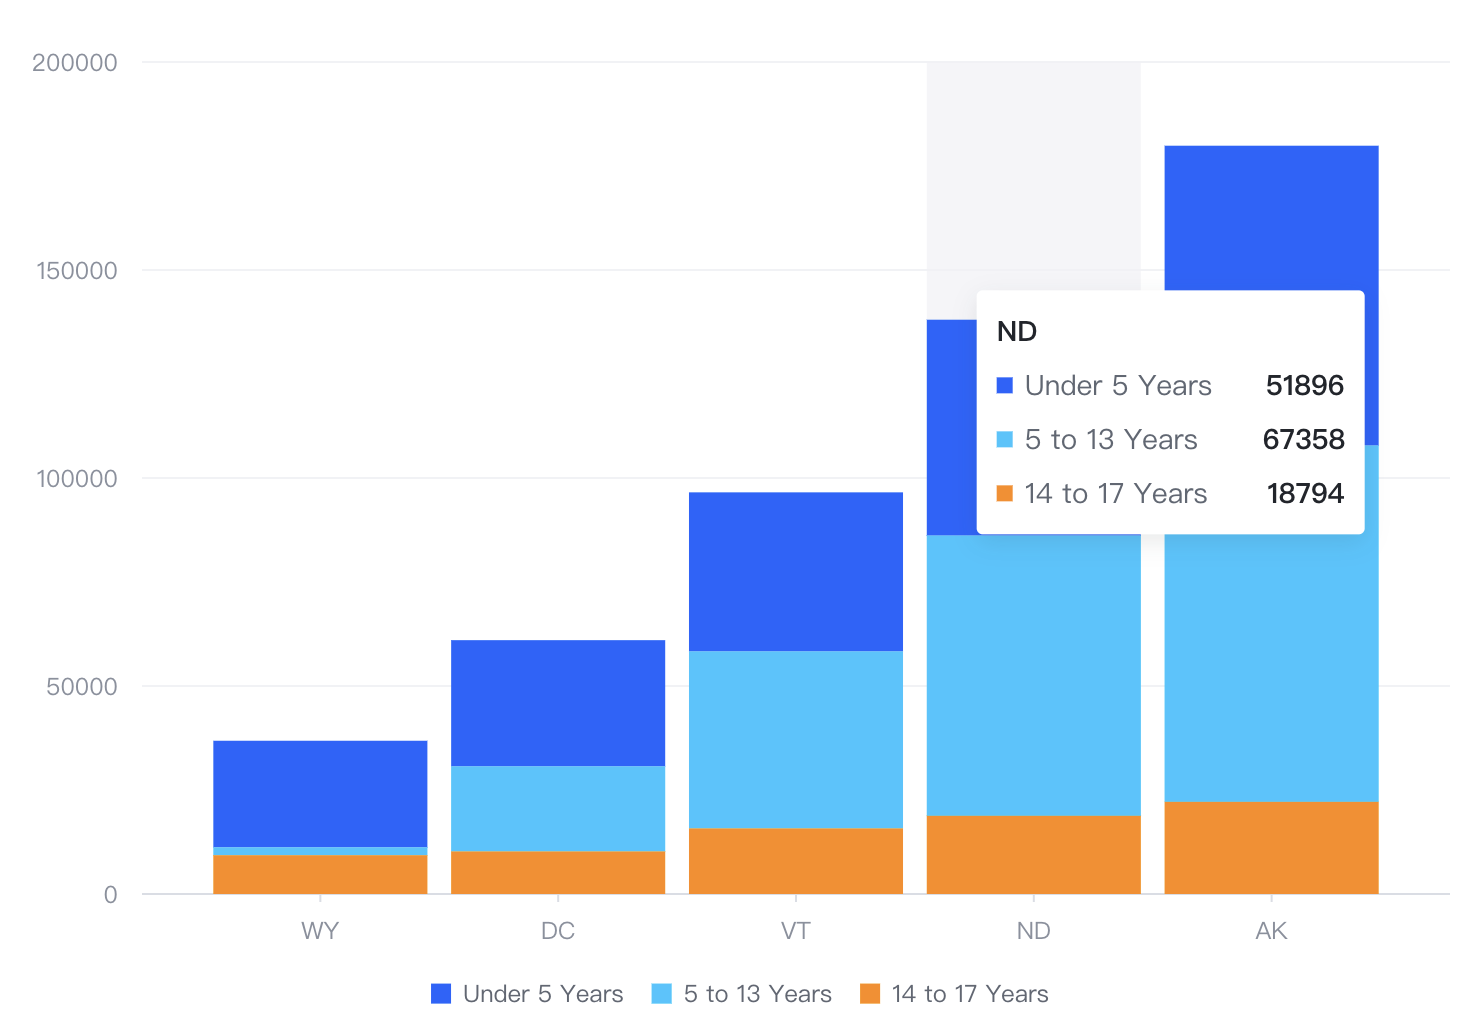
- Solution 1:
stackInverse:trueto adjust the stacking order
{
  stack: true,
  stackInverse: true
}</br>
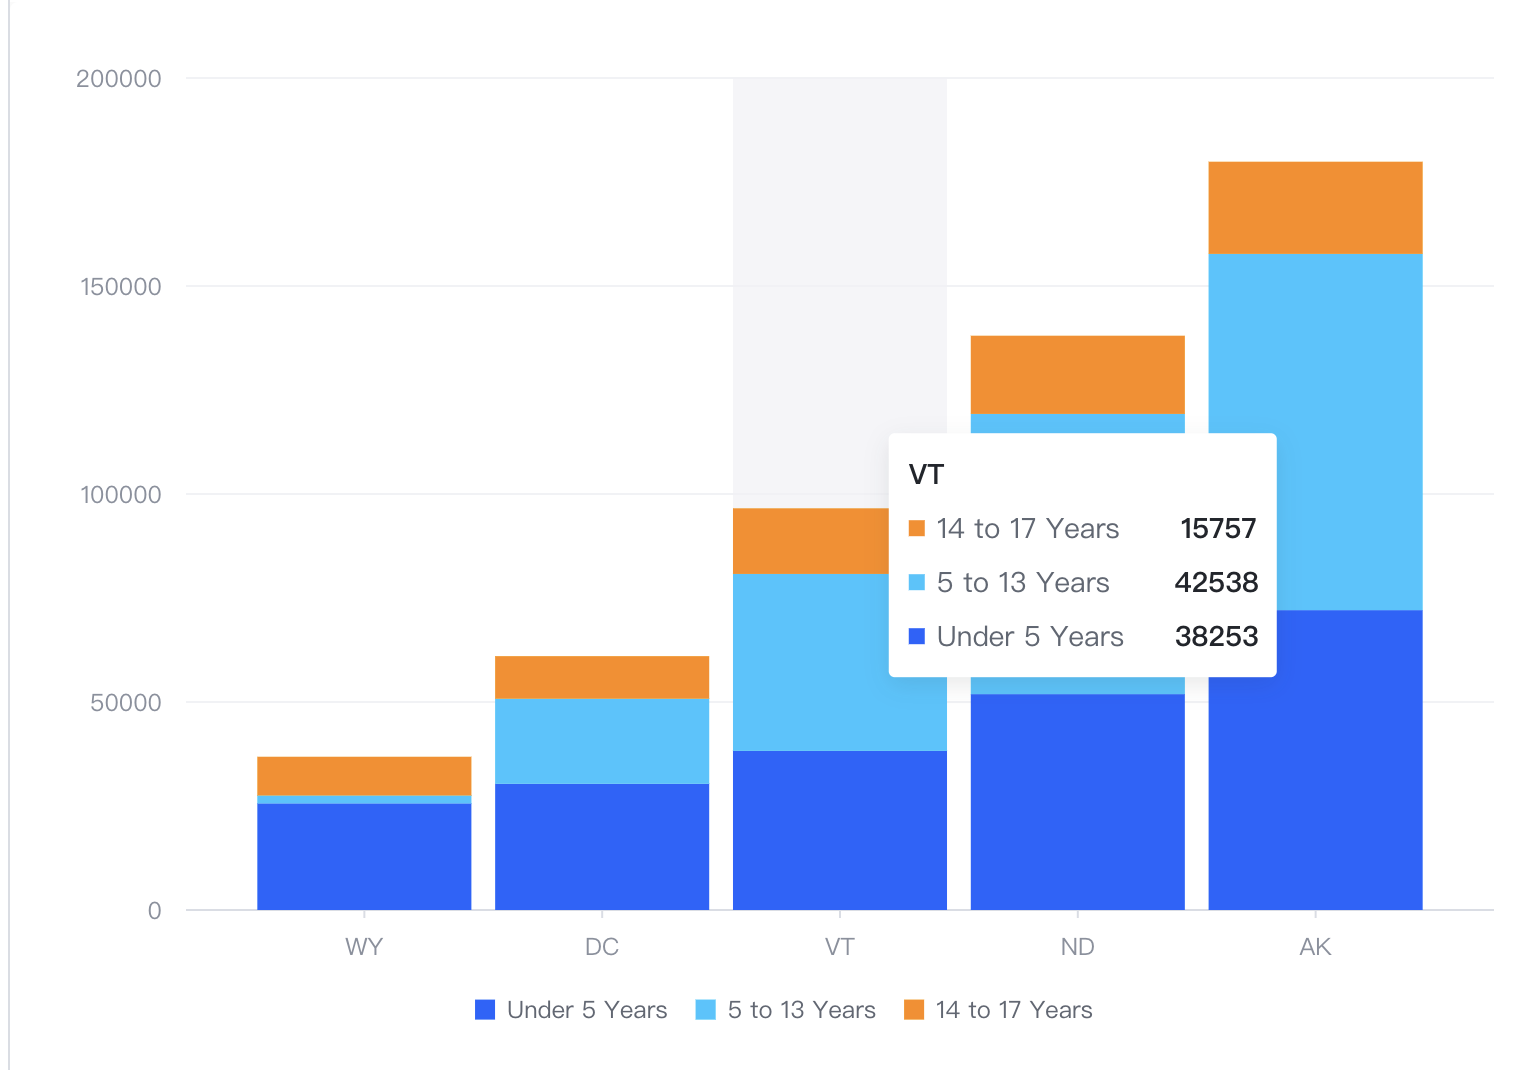
- Solution 2: Adjust the order of elements in the tooltip
tooltip: {
    dimension: {
      updateContent: (items) => {
        return items.reverse();
      }
    }
  }</br>
Code Examples
- Solution 1:
const spec = {
  type: 'bar',
  data: [
    {
      id: 'barData',
      values: [
        {
          State: 'WY',
          Age: 'Under 5 Years',
          Population: 25635
        },
        {
          State: 'WY',
          Age: '5 to 13 Years',
          Population: 1890
        },
        {
          State: 'WY',
          Age: '14 to 17 Years',
          Population: 9314
        },
        {
          State: 'DC',
          Age: 'Under 5 Years',
          Population: 30352
        },
        {
          State: 'DC',
          Age: '5 to 13 Years',
          Population: 20439
        },
        {
          State: 'DC',
          Age: '14 to 17 Years',
          Population: 10225
        },
        {
          State: 'VT',
          Age: 'Under 5 Years',
          Population: 38253
        },
        {
          State: 'VT',
          Age: '5 to 13 Years',
          Population: 42538
        },
        {
          State: 'VT',
          Age: '14 to 17 Years',
          Population: 15757
        },
        {
          State: 'ND',
          Age: 'Under 5 Years',
          Population: 51896
        },
        {
          State: 'ND',
          Age: '5 to 13 Years',
          Population: 67358
        },
        {
          State: 'ND',
          Age: '14 to 17 Years',
          Population: 18794
        },
        {
          State: 'AK',
          Age: 'Under 5 Years',
          Population: 72083
        },
        {
          State: 'AK',
          Age: '5 to 13 Years',
          Population: 85640
        },
        {
          State: 'AK',
          Age: '14 to 17 Years',
          Population: 22153
        }
      ]
    }
  ],
  xField: 'State',
  yField: 'Population',
  seriesField: 'Age',
  stack: true,
  stackInverse: true,
  legends: {
    visible: true
  },
  bar: {
    // The state style of bar
    state: {
      hover: {
        stroke: '#000',
        lineWidth: 1
      }
    }
  }
};

const vchart = new VChart(spec, { dom: CONTAINER_ID });
vchart.renderSync();

// Just for the convenience of console debugging, DO NOT COPY!
window['vchart'] = vchart;</br>
- Option 2
const spec = {
  type: 'bar',
  data: [
    {
      id: 'barData',
      values: [
        {
          State: 'WY',
          Age: 'Under 5 Years',
          Population: 25635
        },
        {
          State: 'WY',
          Age: '5 to 13 Years',
          Population: 1890
        },
        {
          State: 'WY',
          Age: '14 to 17 Years',
          Population: 9314
        },
        {
          State: 'DC',
          Age: 'Under 5 Years',
          Population: 30352
        },
        {
          State: 'DC',
          Age: '5 to 13 Years',
          Population: 20439
        },
        {
          State: 'DC',
          Age: '14 to 17 Years',
          Population: 10225
        },
        {
          State: 'VT',
          Age: 'Under 5 Years',
          Population: 38253
        },
        {
          State: 'VT',
          Age: '5 to 13 Years',
          Population: 42538
        },
        {
          State: 'VT',
          Age: '14 to 17 Years',
          Population: 15757
        },
        {
          State: 'ND',
          Age: 'Under 5 Years',
          Population: 51896
        },
        {
          State: 'ND',
          Age: '5 to 13 Years',
          Population: 67358
        },
        {
          State: 'ND',
          Age: '14 to 17 Years',
          Population: 18794
        },
        {
          State: 'AK',
          Age: 'Under 5 Years',
          Population: 72083
        },
        {
          State: 'AK',
          Age: '5 to 13 Years',
          Population: 85640
        },
        {
          State: 'AK',
          Age: '14 to 17 Years',
          Population: 22153
        }
      ]
    }
  ],
  xField: 'State',
  yField: 'Population',
  seriesField: 'Age',
  stack: true,
  legends: {
    visible: true
  },
  bar: {
    // The state style of bar
    state: {
      hover: {
        stroke: '#000',
        lineWidth: 1
      }
    }
  },
  tooltip: {
    dimension: {
      updateContent: (items) => {
        return items.reverse();
      }
    }
  }
};

const vchart = new VChart(spec, { dom: CONTAINER_ID });
vchart.renderSync();

// Just for the convenience of console debugging, DO NOT COPY!
window['vchart'] = vchart;</br>